如何构建知识图谱
在本指南中,我们将介绍基于非结构化文本构建知识图谱的基本方法。构建的图谱随后可用作 RAG 应用中的知识库。从文本构建知识图谱的高级步骤包括
- 从文本中提取结构化信息:模型用于从文本中提取结构化图信息。
- 存储到图数据库:将提取的结构化图信息存储到图数据库中,从而支持下游 RAG 应用
设置
安装依赖项
提示
有关安装集成包的通用说明,请参阅此部分。
- npm
- yarn
- pnpm
npm i langchain @langchain/community @langchain/openai @langchain/core neo4j-driver zod
yarn add langchain @langchain/community @langchain/openai @langchain/core neo4j-driver zod
pnpm add langchain @langchain/community @langchain/openai @langchain/core neo4j-driver zod
设置环境变量
在此示例中,我们将使用 OpenAI
OPENAI_API_KEY=your-api-key

# Optional, use LangSmith for best-in-class observability
LANGSMITH_API_KEY=your-api-key
LANGSMITH_TRACING=true

# Reduce tracing latency if you are not in a serverless environment
# LANGCHAIN_CALLBACKS_BACKGROUND=true
接下来,我们需要定义 Neo4j 凭据。按照这些安装步骤设置 Neo4j 数据库。
NEO4J_URI="bolt://:7687"
NEO4J_USERNAME="neo4j"
NEO4J_PASSWORD="password"
以下示例将创建与 Neo4j 数据库的连接。
import "neo4j-driver";
import { Neo4jGraph } from "@langchain/community/graphs/neo4j_graph";

const url = process.env.NEO4J_URI;
const username = process.env.NEO4J_USER;
const password = process.env.NEO4J_PASSWORD;
const graph = await Neo4jGraph.initialize({ url, username, password });
LLM 图形转换器
从文本中提取图形数据可以将非结构化信息转换为结构化格式,从而更深入地了解复杂的关联和模式,并更有效地进行导航。 LLMGraphTransformer 通过利用 LLM 解析和分类实体及其关系,将文本文档转换为结构化图形文档。 LLM 模型的选择通过确定提取的图形数据的准确性和细微差别,显著影响输出。
import { ChatOpenAI } from "@langchain/openai";
import { LLMGraphTransformer } from "@langchain/community/experimental/graph_transformers/llm";

const model = new ChatOpenAI({
  temperature: 0,
  model: "gpt-4o-mini",
});

const llmGraphTransformer = new LLMGraphTransformer({
  llm: model,
});
现在我们可以传入示例文本并检查结果。
import { Document } from "@langchain/core/documents";

let text = `
Marie Curie, was a Polish and naturalised-French physicist and chemist who conducted pioneering research on radioactivity.
She was the first woman to win a Nobel Prize, the first person to win a Nobel Prize twice, and the only person to win a Nobel Prize in two scientific fields.
Her husband, Pierre Curie, was a co-winner of her first Nobel Prize, making them the first-ever married couple to win the Nobel Prize and launching the Curie family legacy of five Nobel Prizes.
She was, in 1906, the first woman to become a professor at the University of Paris.
`;

const result = await llmGraphTransformer.convertToGraphDocuments([
  new Document({ pageContent: text }),
]);

console.log(`Nodes: ${result[0].nodes.length}`);
console.log(`Relationships:${result[0].relationships.length}`);
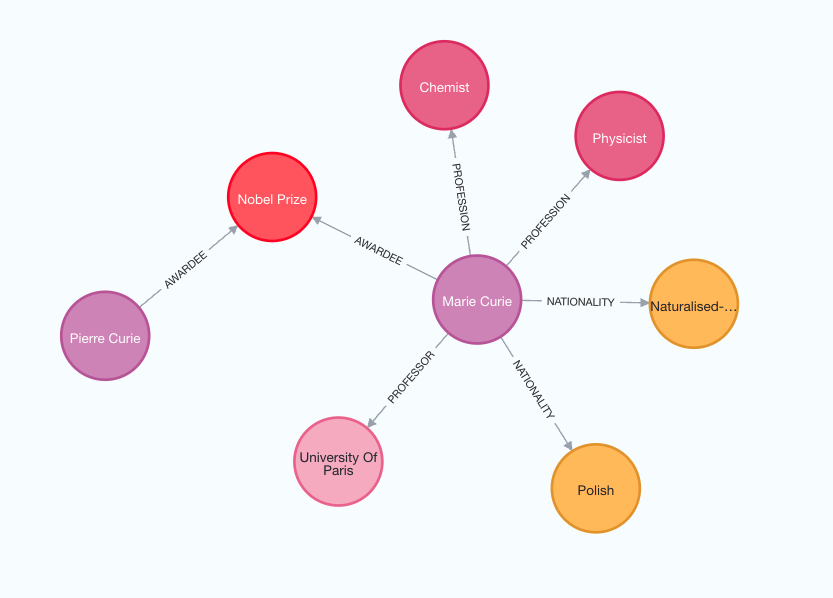
Nodes: 8
Relationships:7
请注意,由于我们使用 LLM,因此图形构建过程是非确定性的。因此,每次执行可能会得到略有不同的结果。查看下图,以便更好地理解生成的知识图谱的结构。

此外,您可以灵活地根据您的要求定义要提取的特定类型的节点和关系。
const llmGraphTransformerFiltered = new LLMGraphTransformer({
  llm: model,
  allowedNodes: ["PERSON", "COUNTRY", "ORGANIZATION"],
  allowedRelationships: ["NATIONALITY", "LOCATED_IN", "WORKED_AT", "SPOUSE"],
  strictMode: false,
});

const result_filtered =
  await llmGraphTransformerFiltered.convertToGraphDocuments([
    new Document({ pageContent: text }),
  ]);

console.log(`Nodes: ${result_filtered[0].nodes.length}`);
console.log(`Relationships:${result_filtered[0].relationships.length}`);
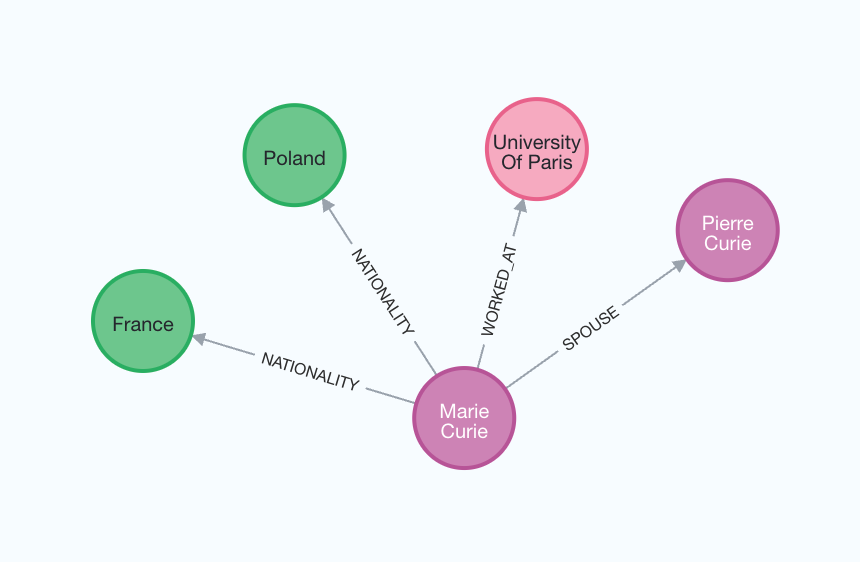
Nodes: 6
Relationships:4
为了更好地理解生成的图形,我们可以再次将其可视化。

存储到图数据库
可以使用 addGraphDocuments 方法将生成的图形文档存储到图数据库。
await graph.addGraphDocuments(result_filtered);